

As autonomous vehicle technology transitions from futuristic concept to everyday utility, the debate surrounding its safety has grown increasingly data-driven. In its latest comprehensive safety update, Waymo has released striking new data illustrating the real-world impact of its robotaxi fleet. Having logged more than 300 human lifetimes’ worth of driving data across major metropolitan areas, the autonomous vehicle pioneer reports that its technology has prevented hundreds of injuries, dramatically outperforming human drivers across nearly every category of urban traffic collision.
The findings arrive at a pivotal time for the autonomous vehicle (AV) industry, offering a granular look at how algorithms manage complex city streets compared to their human counterparts.
Main Facts
Waymo’s latest safety analysis aggregates operational data collected through the end of June 2026. The milestone figures highlight a rapidly scaling fleet and an exponentially growing safety dividend:
- Total Autonomous Mileage: The Waymo Driver has now accumulated more 270 million miles of fully autonomous operations. To put this into perspective, it is the equivalent of driving the entire length of historic Route 66 more than 110,000 times.
- Geographic Reach: The data spans five major metropolitan service areas: Atlanta, Austin, Los Angeles, Phoenix, and San Francisco.
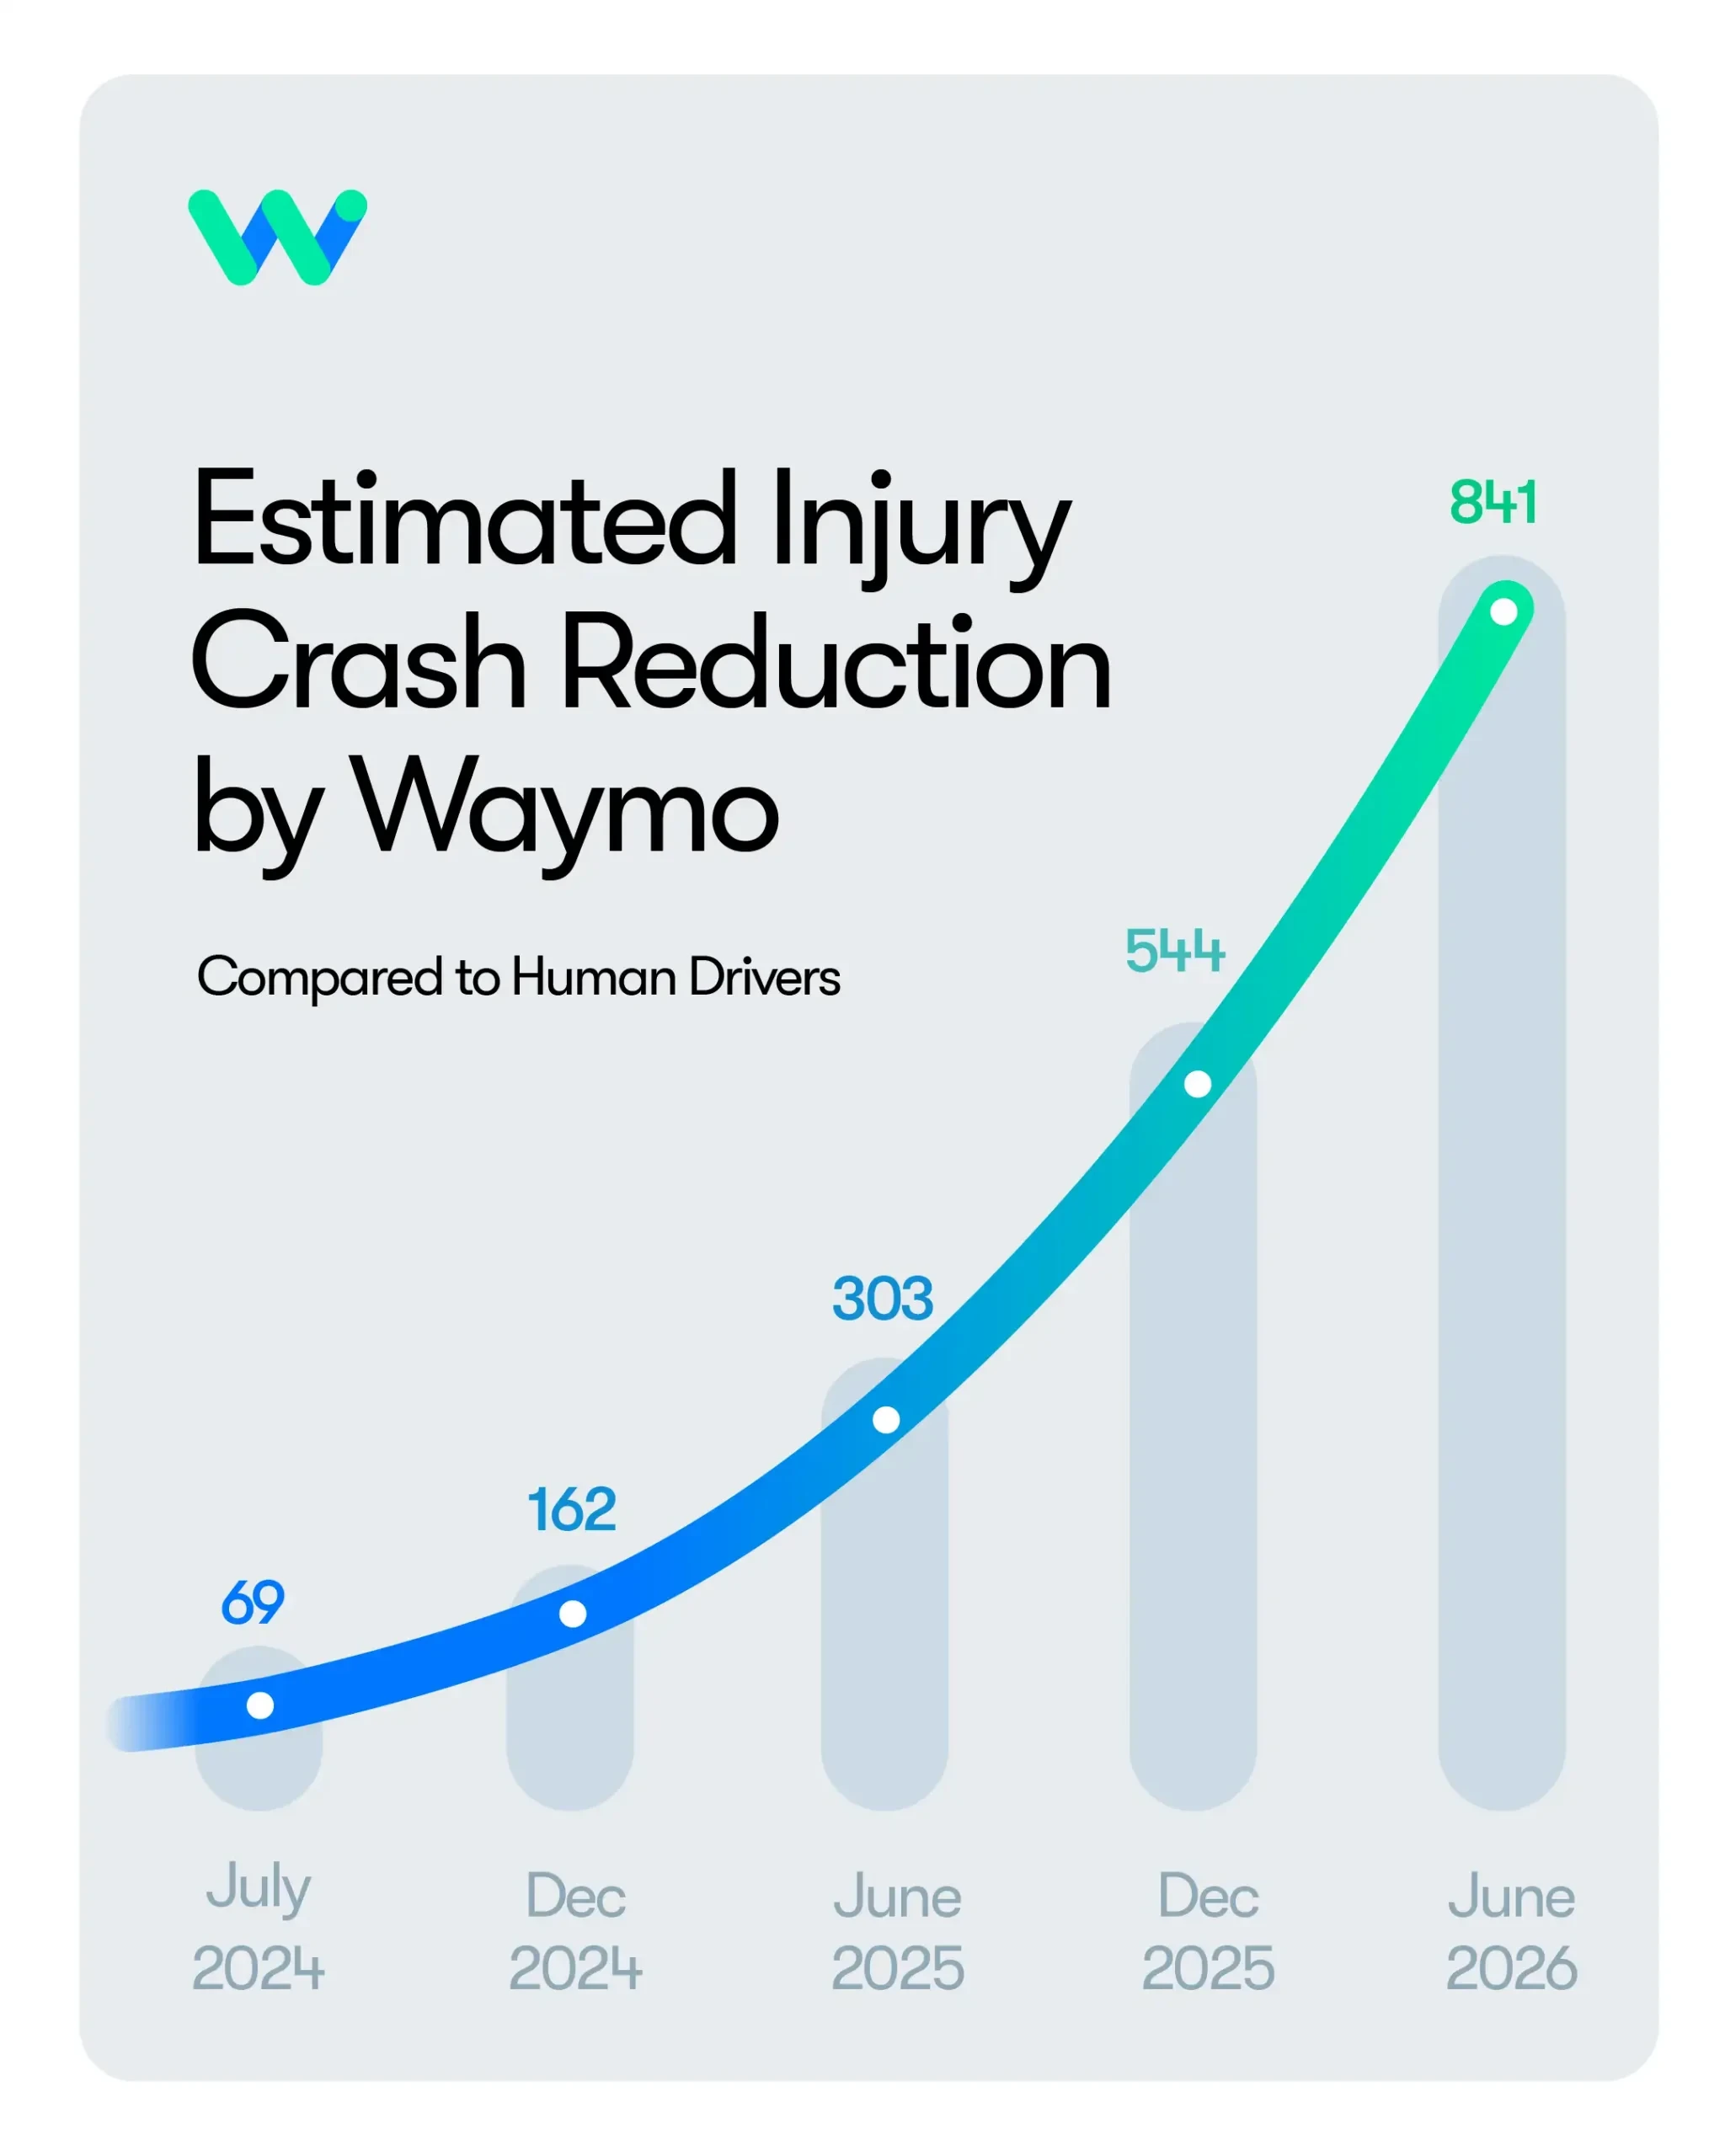
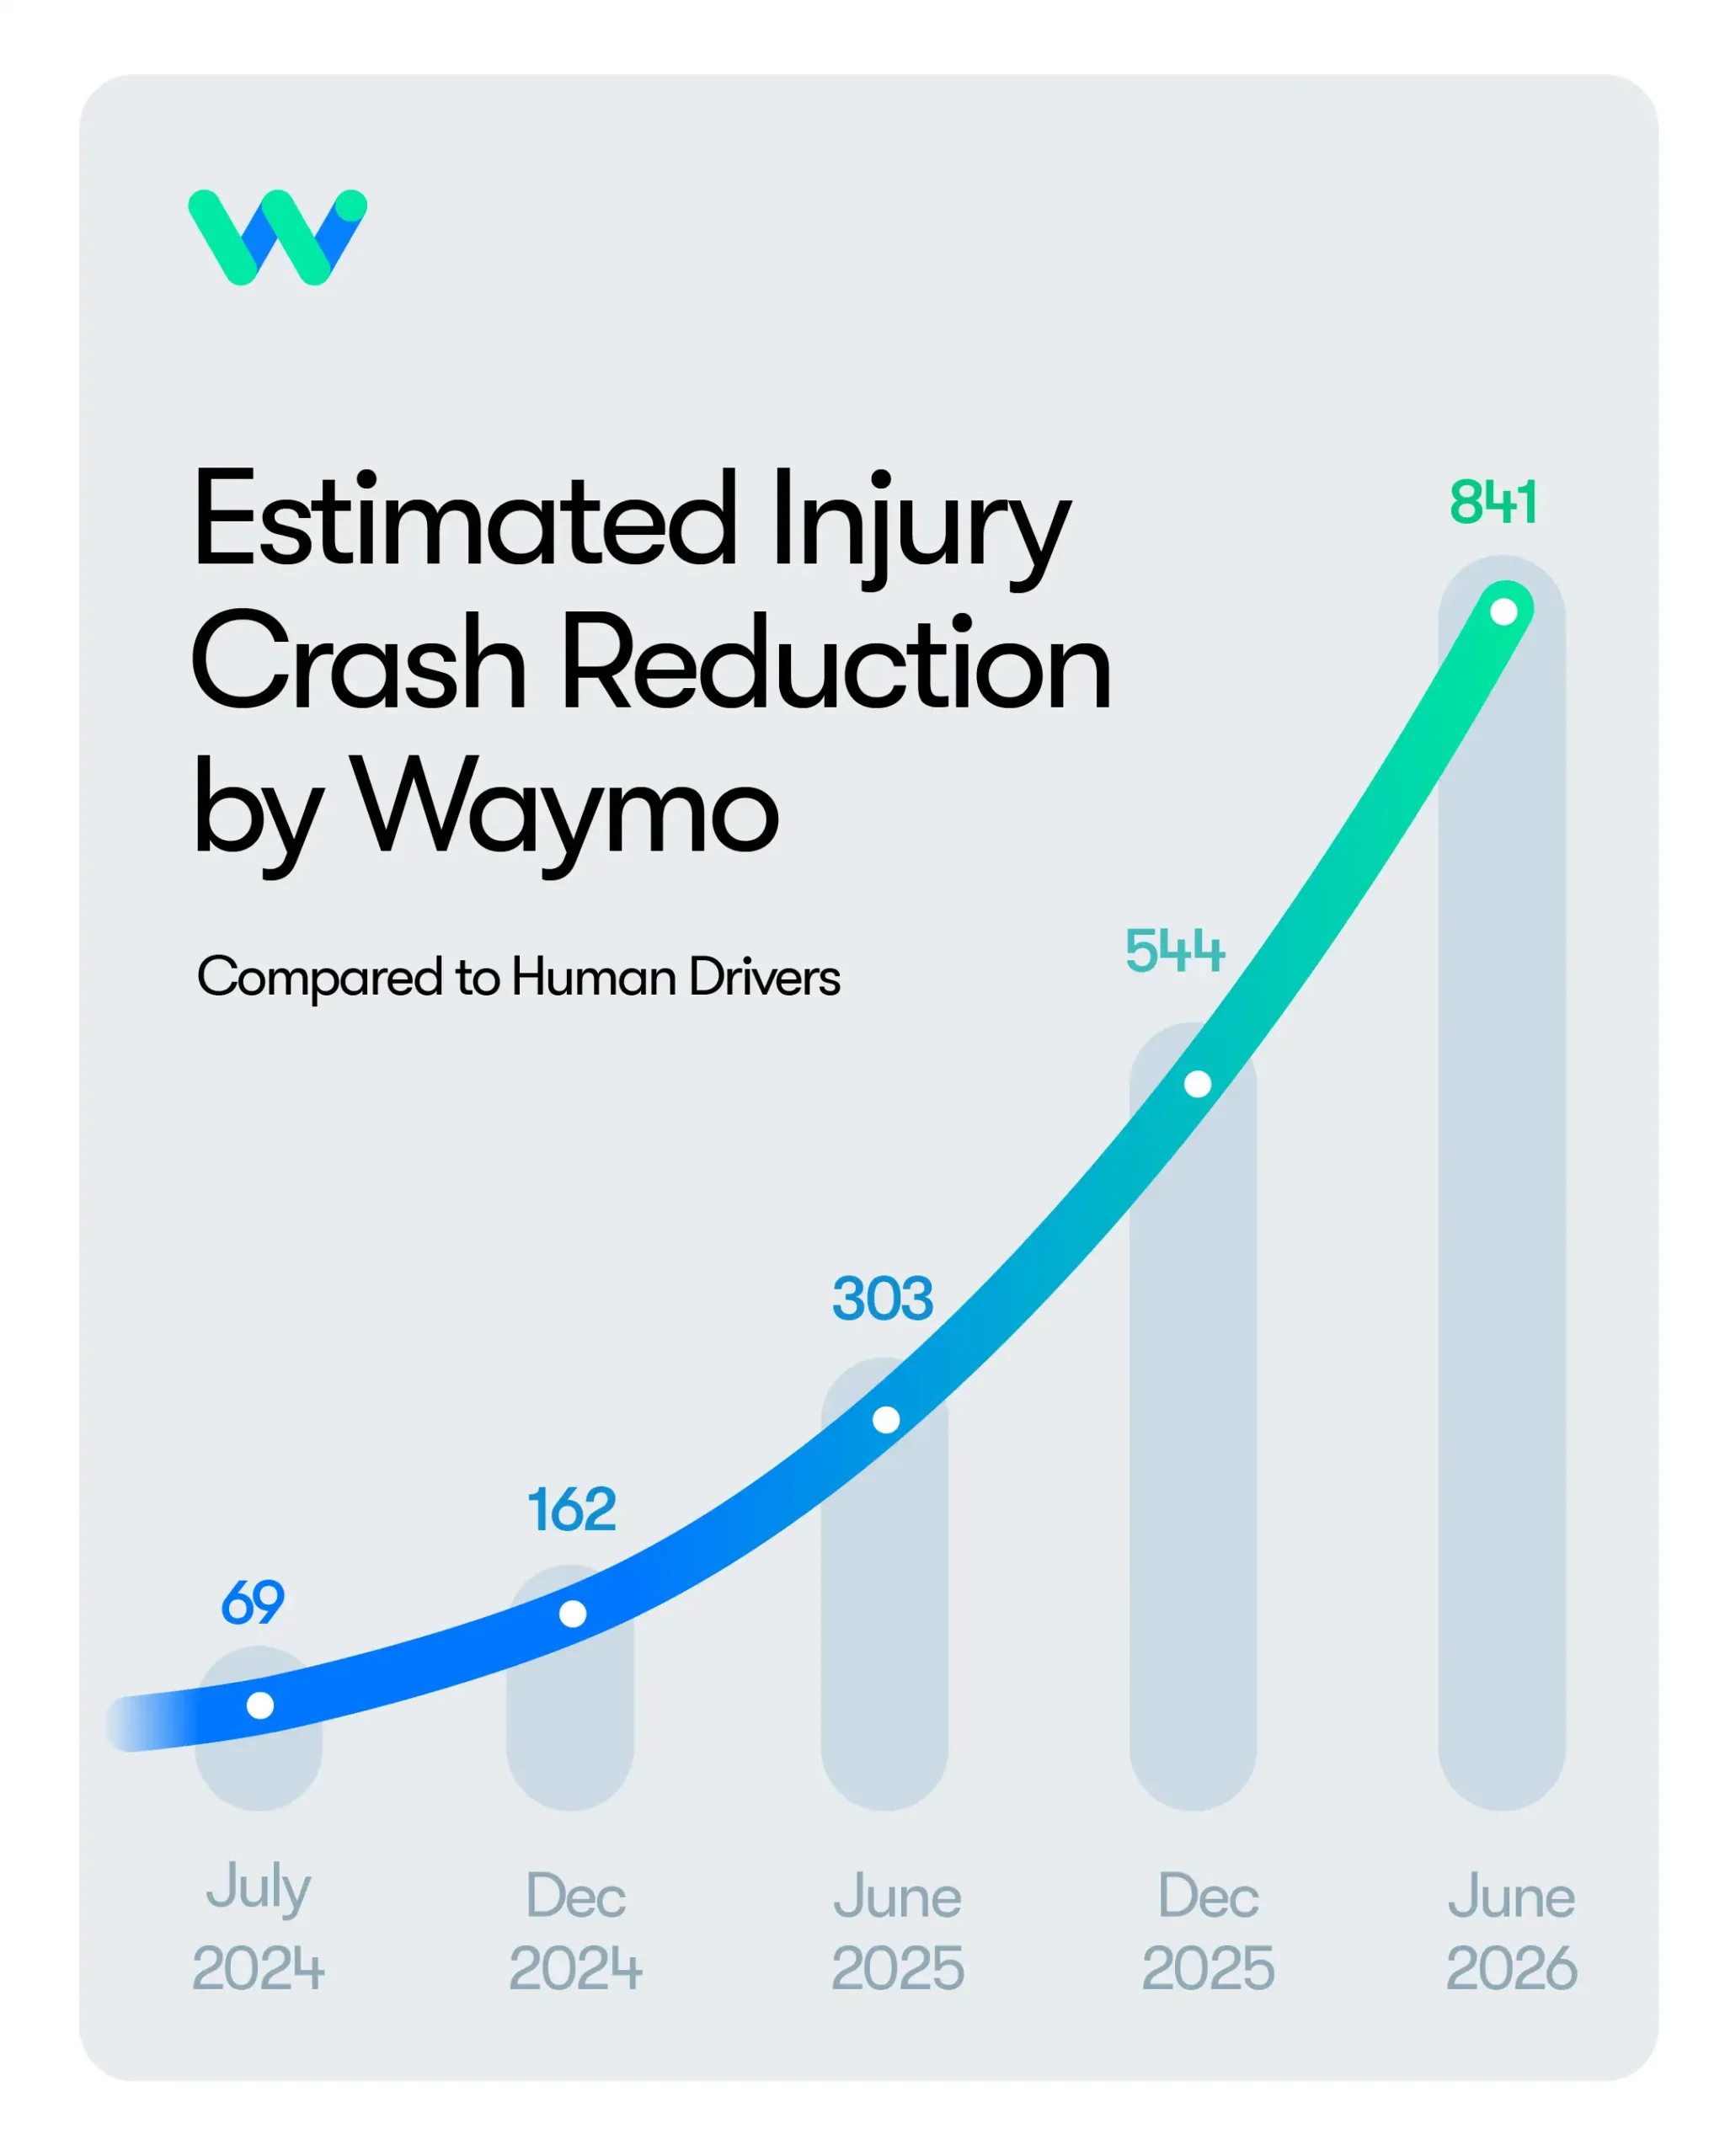
- Overall Injury Reduction: Across these dense urban environments, the Waymo Driver was involved in 841 fewer injury-causing crashes, representing an 82% reduction compared to estimated human driver benchmarks.
- Severe Collisions: The safety gap widens significantly when looking at major accidents. The technology achieved a 95% reduction (roughly 20 times fewer) in serious-injury or worse collisions compared to human averages.
- Vulnerable Road Users: The automated system drastically minimized risks for pedestrians, cyclists, and motorcyclists, recording a 93% reduction in pedestrian injury crashes, an 86% reduction for cyclists, and an 82% reduction for motorcyclists.
Chronology of Progress: From Pilot Programs to Exponential Scale
The trajectory of Waymo’s safety data reveals an accelerating trend that industry analysts are watching closely. The accumulation of autonomous miles has not been linear; rather, as the fleet expands into new markets and scales operations in existing ones, the volume of preventable crashes has grown exponentially.
The Foundation Years (Pre-2024)
Waymo’s early years were characterized by tightly controlled pilot testing, primarily in the suburban grids of Phoenix, Arizona. During this phase, safety data was vital for establishing regulatory trust and proving the fundamental capability of the "Waymo Driver" sensor suite—a combination of LiDAR, radar, and cameras. While the miles accumulated slowly during this era, they laid the foundation for robust algorithmic learning in controlled environments.
Expansion into Complex Urban Cores (2024–2025)
A major turning point occurred when Waymo scaled its commercial services into notoriously difficult driving environments, most notably San Francisco and Los Angeles. These cities introduced complex challenges: aggressive human drivers, unpredictable pedestrian jaywalking, dense network grids, and unique micro-mobility infrastructure like bike lanes. Despite the increased difficulty, the safety metrics continued to favor the autonomous system, proving that the software could adapt to chaotic urban ecosystems.

The December 2025 to June 2026 Surge
The most compelling trend in the latest report is the speed at which avoided injuries are compounding. As of December 2025, Waymo’s data pointed to 544 human injuries entirely avoided. By June 2026—just six months later—that figure surged to 841 avoided injuries. This steep upward trajectory mirrors the rapid fleet expansion and increased ride volume across its active markets, proving that as robotaxis drive more miles, the net positive impact on public safety multiplies rapidly.
Supporting Data and Methodology
To understand how Waymo arrives at these figures, one must examine its methodology, which compares real-world autonomous performance against established human baseline crash rates adjusted for similar driving environments.
The Metrics Behind the Miles
Waymo measures its safety performance using standardized police-reportable and injury-causing crash metrics normalized per million miles driven. The data evaluates collisions regardless of fault, meaning even when human drivers or external factors rear-ended or sideswiped a Waymo vehicle, those incidents are factored into the comprehensive tracking.
| Road User / Collision Type | Waymo vs. Human Benchmark Reduction |
|---|---|
| Overall Injury-Causing Crashes | 82% Reduction |
| Severe / Fatal-Level Collisions | 95% Reduction (20x fewer) |
| Pedestrian Incidents | 93% Reduction |
| Cyclist Incidents | 86% Reduction |
| Motorcyclist Incidents | 82% Reduction |
The Science of Rigorous Testing
Waymo emphasizes that its safety framework is not merely reactive but deeply proactive. Before any software iteration or hardware update is deployed onto public roads, the Waymo Driver undergoes a rigorous formal safety review.
The evaluation criteria align with advanced industry standards, such as those detailed in academic and engineering literature addressing the "absence of unreasonable risk" for automated driving systems (ADS). By benchmarking their acceptance criteria against these peer-reviewed frameworks, Waymo aims to establish a transparent, scientifically sound justification for public deployment.
Official Responses and Industry Perspectives
Waymo’s leadership and safety teams have framed these milestones as a testament to the maturation of autonomous driving technology.
In official corporate statements released alongside the September data update, the company underscored the unique spatial awareness of its sensor suite. Unlike human drivers—who are frequently prone to distraction, fatigue, intoxication, or obstructed lines of sight—the Waymo Driver maintains a 360-degree field of view processing inputs simultaneously in real time.
"The safety impact extends directly to where road users are most exposed," Waymo noted in its safety blog. "Whether it’s riding in a bike lane alongside the vehicle, stepping into a crosswalk at dusk, or navigating dense traffic on a motorcycle, the Waymo Driver significantly reduces risk."
Transportation analysts and urban planners have also weighed in on the data. Proponents of autonomous transit argue that the statistical proof is now too substantial to ignore. With human error accounting for the vast majority of the tens of thousands of traffic fatalities occurring annually in the United States, transitioning even a fraction of urban miles to autonomous fleets presents an unprecedented public health opportunity.
Implications for the Future of Urban Mobility
The implications of Waymo’s 270-million-mile milestone extend far beyond corporate PR or technology enthusiasts. They touch on urban planning, public policy, infrastructure development, and the future of personal mobility.
1. A Shift in Public Policy and Regulatory Support
For years, autonomous vehicle expansion has faced intense local pushback, regulatory hurdles, and skepticism from municipal governments concerned about traffic snarls or unexpected vehicle stops. However, as quantitative data increasingly demonstrates an 82% reduction in overall injuries and a staggering 95% drop in severe crashes, the conversation is shifting.
Policy experts suggest that cities may soon need to rethink how they view robotaxis. Rather than treating them as a disruption to manage, forward-thinking municipalities might look toward incentivizing or integrating autonomous fleets into broader Vision Zero initiatives aimed at eliminating traffic fatalities altogether. Some analysts even argue that public subsidies or preferential lane access could be justified if these services demonstrably save human lives on a mass scale.

2. Infrastructure and Vulnerable Road User Protection
Urban environments are inherently shared spaces. The dramatic reduction in crashes involving pedestrians (93%), cyclists (86%), and motorcyclists (82%) highlights the profound capability of AV sensors to detect unpredictable human behavior in complex environments. At dusk, in poorly lit intersections, or alongside crowded bike lanes, the autonomous vehicle’s refusal to experience fatigue or loss of attention provides a protective buffer for the most vulnerable people on the road.
3. Commercial Viability and Organic Growth
While safety is the primary moral and regulatory hurdle, it directly feeds the business case. Public trust is the ultimate currency for the robotaxi industry. As riders experience safer, more reliable journeys, demand for services in cities like San Francisco, Phoenix, and Austin continues to scale organically. The exponential growth in avoided injuries directly mirrors the exponential growth in commercial ride adoption.
Looking Ahead
As Waymo continues to log millions of additional miles each month and expands into new cities like Atlanta and Austin, its dataset will only grow more robust. The question facing the transportation sector is no longer if autonomous vehicles are safer than human drivers under normal operating conditions, but how quickly society can adapt infrastructure, regulations, and public perception to embrace a safer automotive future.
For now, the numbers speak for themselves: 300 human lifetimes of driving data point definitively to a world where the future of mobility is markedly safer than its past.
