

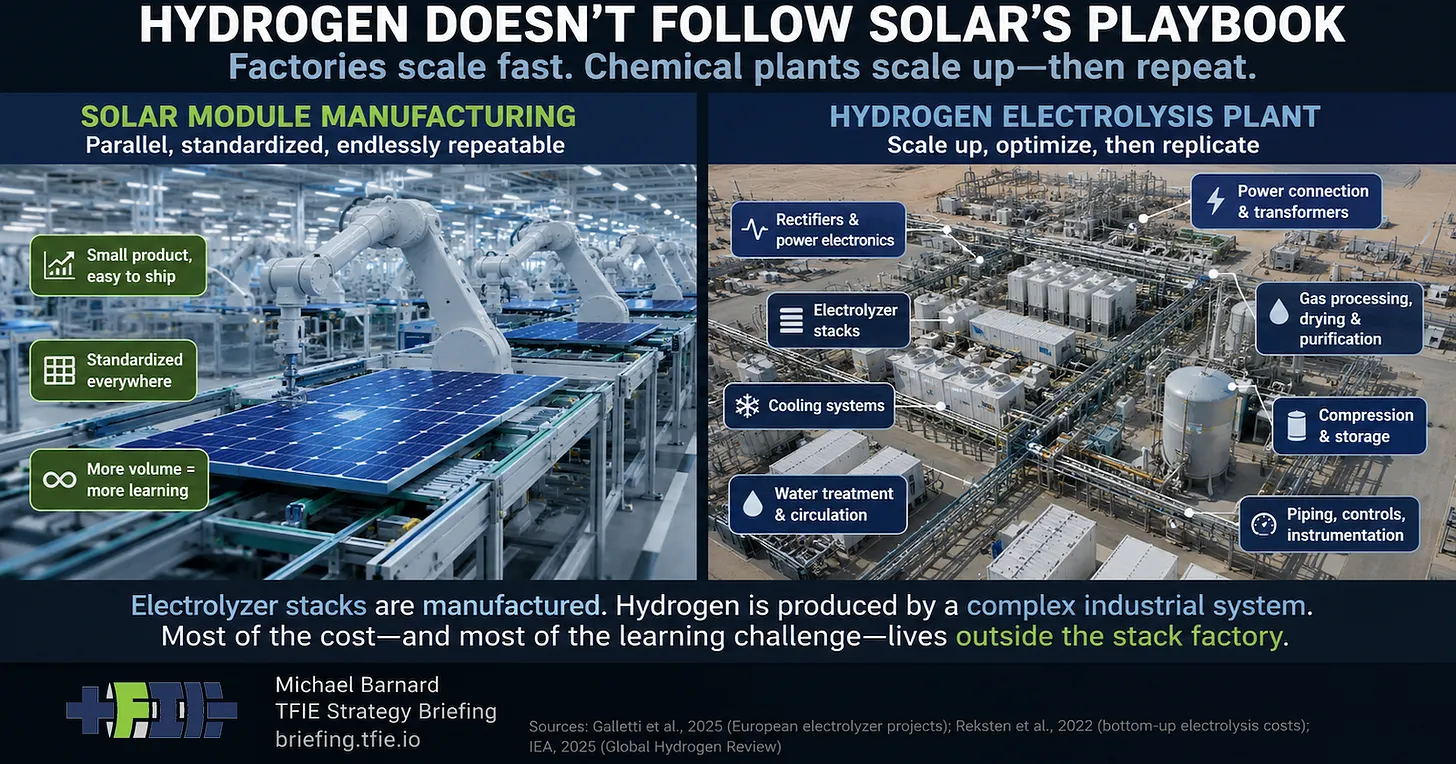
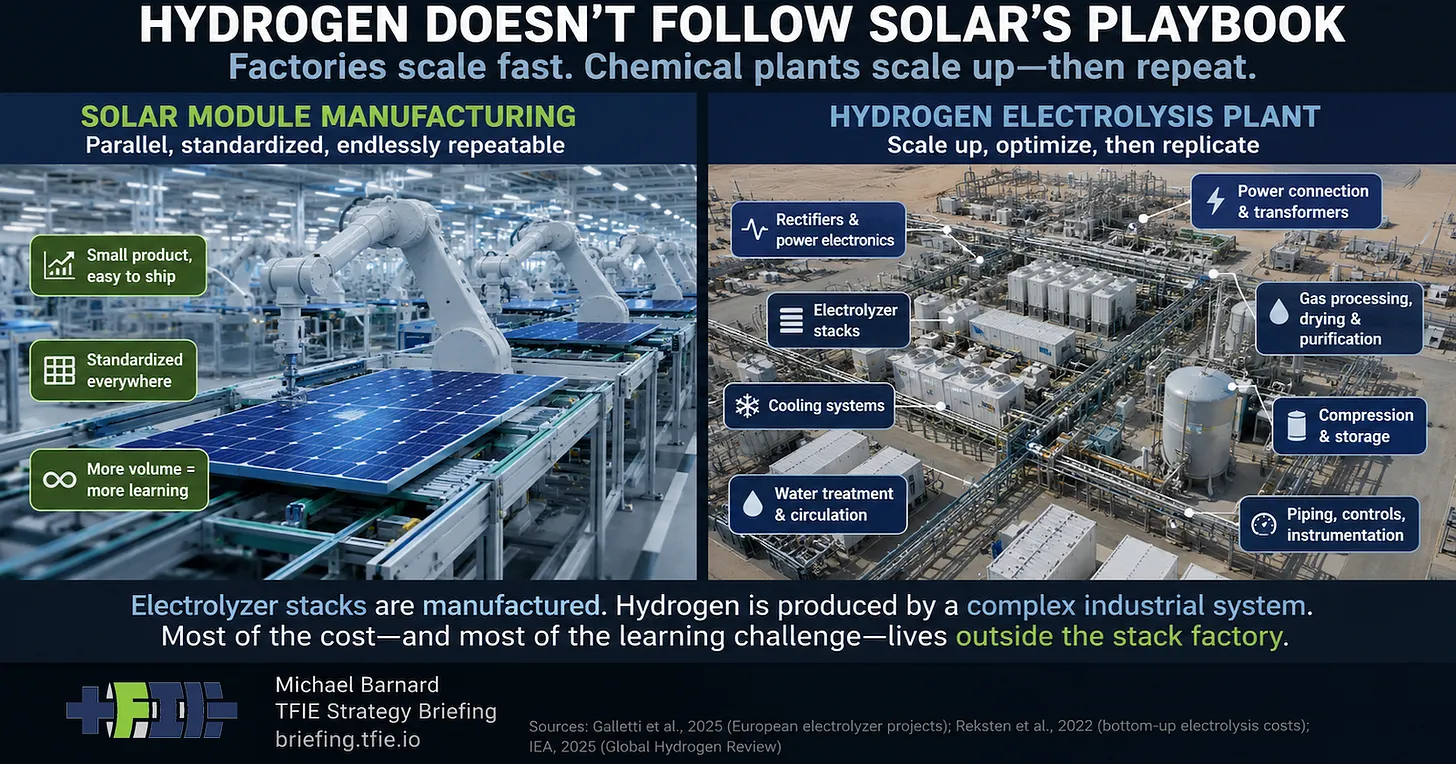
Electrolyzer stacks are manufactured, but hydrogen plants are built. Behind this deceptively simple distinction lies one of the most significant miscalculations in modern clean energy forecasting.
For years, analysts modeling the future of the green hydrogen economy have borrowed a page from the solar and battery playbooks: the empirical experience curve. The logic is straightforward—every time cumulative global deployment doubles, capital costs are expected to fall by a fixed percentage. By charting these historical learning rates forward, forecasters predict rapid, compounding cost reductions for clean hydrogen over the coming decades.
However, new evidence reveals that applying solar-style learning curves to hydrogen production is fundamentally flawed. Electrolyzers and complete hydrogen plants belong to an entirely different economic reference class than mass-produced silicon modules or lithium-ion cells.
When researchers strip away the misleading effects of facility upscaling, balance-of-plant dynamics, and system boundaries, the illusion of a steep, inevitable cost trajectory begins to fracture. Low-carbon hydrogen will undoubtedly become cheaper than it is today, but policymakers, investors, and project developers must radically adjust how they model its economic future.
Chronology of an Analytical Blind Spot: From Solar Success to Hydrogen Hype
To understand why hydrogen cost forecasts are missing their marks, it is helpful to trace how these analytical frameworks evolved.
- The Solar and Battery Era (2010s): The clean-energy transition was largely defined by the stunning, predictable cost declines of solar photovoltaics and lithium-ion batteries. In both cases, manufacturing a module or a cell was the primary cost driver. Doubling cumulative gigawatts neatly translated into factory floor repetition, mass production, and sweeping supply chain efficiencies.
- The Rise of the Hydrogen Economy (Late 2010s–2020s): As governments and industries set aggressive net-zero targets, analysts sought to replicate solar learning curves for green hydrogen. They tracked cumulative installed electrolyzer capacity (measured in gigawatts) and mapped it against capital expenditure (CAPEX) per kilowatt, expecting similar multi-decade cost crashes.
- The 2025 Reality Check: A wave of recent studies—most notably a comprehensive 2025 European electrolyzer-project analysis published in ScienceDirect—began questioning the raw data. Researchers discovered that what analysts were labeling as "learning" was often just the one-off savings of building larger facilities rather than true manufacturing repetition.
Supporting Data: Dissecting the Numbers Behind Electrolyzer Costs
The disconnect between raw data and actual manufacturing experience is laid bare when examining project-level metrics from the past two decades.
When looking at raw, unadjusted project data from 2005 onward, the apparent experience rates look phenomenal. Costs appeared to fall by 23.3% across all projects, 32.1% for Proton Exchange Membrane (PEM), and 22.9% for alkaline electrolysis for every doubling of cumulative installed capacity. On paper, these figures matched or even exceeded the historical learning curves of solar power.
RAW VS. NORMALIZED EXPERIENCE RATES (Cost drop per capacity doubling)
-------------------------------------------------------------------
Technology       Raw Learning Rate    Normalized Learning Rate
-------------------------------------------------------------------
All Projects     23.3%                13.3%
PEM              32.1%                17.6%
Alkaline         22.9%                7.3% (Statistically Insignificant)
However, when the researchers normalized project costs to account for estimated project-size economies—adjusting for the fact that facilities were simply getting bigger—the learning rates plummeted.
- The normalized rate for all projects dropped to 13.3%.
- The rate for PEM systems fell to 17.6%.
- The rate for alkaline systems dropped to 7.3%, rendering the remaining relationship statistically insignificant.
Costs did decline, but the raw experience curve was erroneously attributing several completely different economic mechanisms—such as physical upscaling and bulk equipment purchasing—to pure "manufacturing learning."
The Problem with the Denominator: Stacks vs. Plants
Another major flaw in cumulative gigawatt models is how they treat physical expansion. Suppose global cumulative electrolysis capacity rises from 5 GW to 50 GW—a tenfold increase, or roughly 3.32 doublings of installed capacity.
If the average finished stack remains 1 megawatt (MW), the completed stack count also rises tenfold (from 5,000 to 50,000 units). In this scenario, capacity doublings and stack-count doublings track one another neatly.
However, if average stack size scales up from 1 MW to 5 MW during that same expansion period, the industry only requires 10,000 stacks to hit 50 GW. Installed capacity still records 3.32 doublings, but completed stack count has effectively doubled only once. The factories are gaining some experience, but not nearly at the breakneck pace implied by the soaring gigawatt totals.
Official Perspectives and Industry Insights
Energy agencies and industry insiders are increasingly acknowledging the structural limits of hydrogen cost reductions.
According to a comprehensive 2025 International Energy Agency (IEA) electrolyzer cost breakdown, the stack itself represents a surprisingly small fraction of an installed project’s total capital expenditure:

- Electrolyzer Stacks: Represent only 15% to 20% of total installed capital cost.
- Balance of Plant (BoP): Roughly 25% to 30% sits in power electronics, piping, compressors, and gas treatment systems.
- Engineering, Procurement, Construction (EPC) & Contingency: Can account for more than 50% of the total capital expenditure.
This distribution creates a stark mathematical ceiling for cost reduction. Even if a manufacturer achieves a stellar 20% cost reduction in the stack—which represents just one-fifth of the total CAPEX—it removes only about 4% from the overall installed project cost.
The remaining 80% to 85% of the project relies on civil works, heavy electrical connections, compressors, and construction. These elements follow their own distinct productivity trajectories and local labor market constraints, rather than automatically inheriting the rapid learning curve of a specialized stack factory.
Implications for the Future of Clean Energy
Recognizing these economic realities does not mean green hydrogen is a dead end. Rather, it demands a more sophisticated approach to planning, financing, and deployment.
1. The End of "First-of-a-Kind" Pains
Many of the steepest cost reductions observed in early hydrogen projects are not permanent trends; they are one-off corrections. The industry is currently making the transition from small, inefficient demonstration projects to properly scaled industrial facilities. Once compressors, transformers, and shared balance-of-plant systems reach their optimal economic scale, further capacity additions will come from replicating standard process trains rather than capturing massive scale efficiencies.
2. Electricity Dominates Variable Costs
Even if manufacturing innovation completely eliminated stack costs, electricity remains the dominant variable expense in hydrogen production. Manufacturing learning cannot alter the laws of thermodynamics or the market price of power. Furthermore, very cheap wind and solar electricity tends to be intermittent, whereas capital-intensive hydrogen equipment requires high utilization rates to remain economically viable.
3. A Call for Defensible Forecasting
A realistic hydrogen forecast must disentangle and independently model:
- Electrochemical performance and stack-size effects.
- Chemical-plant scale economies and repeat engineering.
- Construction productivity and balance-of-plant procurement.
- External variables such as electricity pricing, financing costs, and logistics.
Conclusion
Hydrogen will undoubtedly become cheaper than many early-generation projects suggest. However, the energy transition cannot rely on lazy assumptions borrowed from solar and battery paradigms. By structuring future plans around the real-world prices complete systems can realistically achieve—and directing the molecule toward high-value applications where it is truly indispensable—the clean energy sector can build a resilient, economically viable hydrogen economy.
